> ## Documentation Index
> Fetch the complete documentation index at: https://docs.dakora.io/llms.txt
> Use this file to discover all available pages before exploring further.
# Observability & Analytics
> Track executions, analyze costs, and optimize your AI agent spending
## Overview
Dakora provides complete visibility into your AI agent operations:
* **Analytics dashboard** with cost trends and performance metrics
* **Execution traces** with full conversation history
* **Budget monitoring** with alerts and enforcement
* **AI-powered optimization** to reduce spending
 ## How Tracking Works
When you render templates with the SDK, executions are automatically tracked:
```python theme={null}
from dakora import Dakora
client = Dakora()
# Render tracks template usage automatically
result = await client.prompts.render(
"support_response",
{"customer_name": "Alice", "issue": "Login problem"},
)
# Embedded metadata links this prompt to executions
print(result.text) # Includes tracking marker
```
The rendered text includes a metadata marker that links LLM calls back to your template. This enables accurate cost attribution.
### Data Flow
1. **Template Rendering** - SDK embeds a metadata marker in your prompt
2. **LLM Call** - Your agent framework makes the API call
3. **Span Ingestion** - OpenTelemetry spans are sent to Dakora
4. **Template Linkage** - Dakora matches spans to templates via markers
5. **Analytics** - Usage aggregated for dashboards and recommendations
### What Gets Tracked
| Field | Description |
| -------------------------- | ------------------------------------------ |
| `trace_id` | Unique identifier for the execution |
| `provider` | LLM provider (openai, azure\_openai, etc.) |
| `model` | Model identifier used |
| `tokens_in` / `tokens_out` | Token counts |
| `cost_usd` | Calculated cost based on pricing |
| `latency_ms` | Response time in milliseconds |
| `messages` | Full input/output message history |
***
## Analytics Dashboard
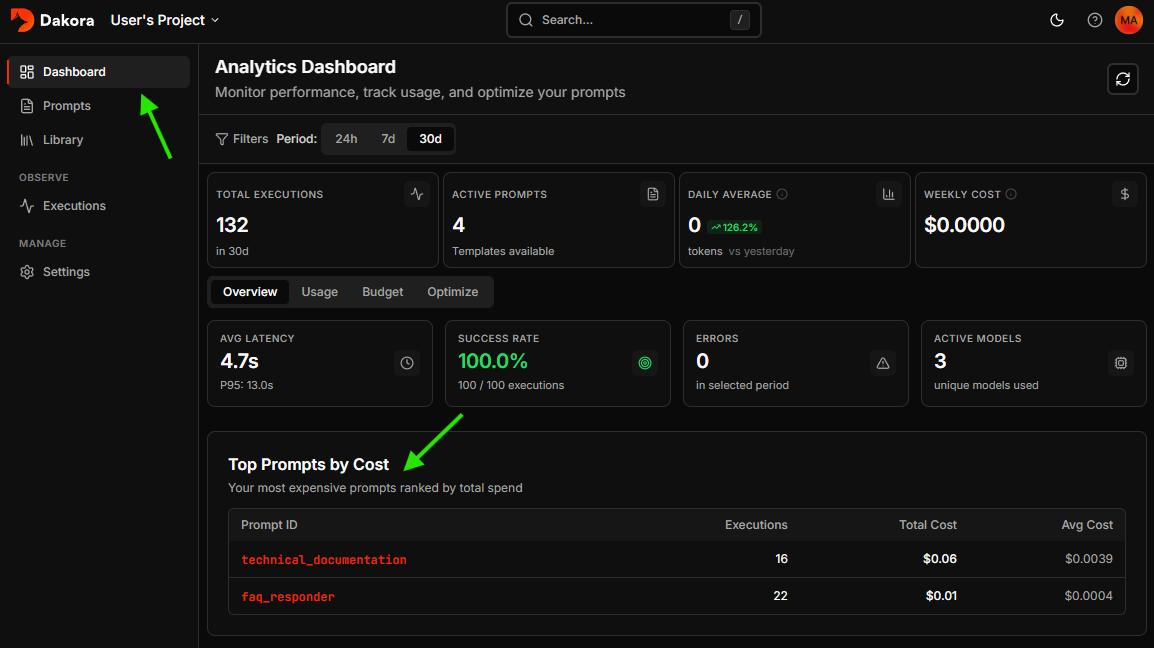
Access the Analytics Dashboard from your project sidebar for aggregate insights.
### Key Metrics
| Metric | Description |
| ---------------- | ------------------------------------ |
| Total Executions | LLM calls in the selected time range |
| Active Prompts | Template count currently in use |
| Daily Average | Token consumption over last 24 hours |
| Weekly Cost | Total spend for past 7 days |
### Time Range
Toggle between periods:
* **Last 24 hours** - Real-time monitoring
* **Last 7 days** - Weekly trends
* **Last 30 days** - Monthly planning
### Health Metrics
The Overview tab shows:
* **Avg Latency** with P95/P99 percentiles
* **Success Rate** with error breakdown
* **Error Count** for the selected period
High P95/P99 latency compared to average indicates occasional slow responses. Consider investigating slow model calls.
### Token Usage Timeline
An interactive chart showing consumption over time:
* Hover to see tokens, cost, and execution count
* Identify usage spikes and patterns
* Correlate with deployments or traffic changes
### Model Distribution
See which models consume your tokens:
```
gpt-4o-mini │████████████████████░░░│ 45% (2.3M tokens)
gpt-4o │████████░░░░░░░░░░░░░░░│ 28% (1.4M tokens)
claude-3-haiku │████░░░░░░░░░░░░░░░░░░░│ 15% (760K tokens)
```
***
## Executions List
Navigate to **Executions** in your project sidebar to view all LLM calls.
### Filtering
| Filter | Description |
| ------------- | --------------------------------------------- |
| Provider | Filter by LLM provider (OpenAI, Azure OpenAI) |
| Model | Search for specific models (e.g., "gpt-4o") |
| Agent ID | Show calls from a specific agent |
| Prompt ID | Filter by template usage |
| Has Templates | Toggle to show only template-linked calls |
Use the "Has Templates" filter to focus on executions that used your Dakora templates.
### Performance Badges
Executions are tagged with performance indicators:
* 🟢 **Fast** - Under 2 seconds
* 🟡 **Normal** - 2-5 seconds
* 🟠 **Slow** - 5-10 seconds
* 🔴 **Very Slow** - Over 10 seconds
High-cost calls (over \$0.05) receive a cost badge for quick identification.
***
## Trace Detail
Click any execution to see the full trace view.
## How Tracking Works
When you render templates with the SDK, executions are automatically tracked:
```python theme={null}
from dakora import Dakora
client = Dakora()
# Render tracks template usage automatically
result = await client.prompts.render(
"support_response",
{"customer_name": "Alice", "issue": "Login problem"},
)
# Embedded metadata links this prompt to executions
print(result.text) # Includes tracking marker
```
The rendered text includes a metadata marker that links LLM calls back to your template. This enables accurate cost attribution.
### Data Flow
1. **Template Rendering** - SDK embeds a metadata marker in your prompt
2. **LLM Call** - Your agent framework makes the API call
3. **Span Ingestion** - OpenTelemetry spans are sent to Dakora
4. **Template Linkage** - Dakora matches spans to templates via markers
5. **Analytics** - Usage aggregated for dashboards and recommendations
### What Gets Tracked
| Field | Description |
| -------------------------- | ------------------------------------------ |
| `trace_id` | Unique identifier for the execution |
| `provider` | LLM provider (openai, azure\_openai, etc.) |
| `model` | Model identifier used |
| `tokens_in` / `tokens_out` | Token counts |
| `cost_usd` | Calculated cost based on pricing |
| `latency_ms` | Response time in milliseconds |
| `messages` | Full input/output message history |
***
## Analytics Dashboard
Access the Analytics Dashboard from your project sidebar for aggregate insights.
### Key Metrics
| Metric | Description |
| ---------------- | ------------------------------------ |
| Total Executions | LLM calls in the selected time range |
| Active Prompts | Template count currently in use |
| Daily Average | Token consumption over last 24 hours |
| Weekly Cost | Total spend for past 7 days |
### Time Range
Toggle between periods:
* **Last 24 hours** - Real-time monitoring
* **Last 7 days** - Weekly trends
* **Last 30 days** - Monthly planning
### Health Metrics
The Overview tab shows:
* **Avg Latency** with P95/P99 percentiles
* **Success Rate** with error breakdown
* **Error Count** for the selected period
High P95/P99 latency compared to average indicates occasional slow responses. Consider investigating slow model calls.
### Token Usage Timeline
An interactive chart showing consumption over time:
* Hover to see tokens, cost, and execution count
* Identify usage spikes and patterns
* Correlate with deployments or traffic changes
### Model Distribution
See which models consume your tokens:
```
gpt-4o-mini │████████████████████░░░│ 45% (2.3M tokens)
gpt-4o │████████░░░░░░░░░░░░░░░│ 28% (1.4M tokens)
claude-3-haiku │████░░░░░░░░░░░░░░░░░░░│ 15% (760K tokens)
```
***
## Executions List
Navigate to **Executions** in your project sidebar to view all LLM calls.
### Filtering
| Filter | Description |
| ------------- | --------------------------------------------- |
| Provider | Filter by LLM provider (OpenAI, Azure OpenAI) |
| Model | Search for specific models (e.g., "gpt-4o") |
| Agent ID | Show calls from a specific agent |
| Prompt ID | Filter by template usage |
| Has Templates | Toggle to show only template-linked calls |
Use the "Has Templates" filter to focus on executions that used your Dakora templates.
### Performance Badges
Executions are tagged with performance indicators:
* 🟢 **Fast** - Under 2 seconds
* 🟡 **Normal** - 2-5 seconds
* 🟠 **Slow** - 5-10 seconds
* 🔴 **Very Slow** - Over 10 seconds
High-cost calls (over \$0.05) receive a cost badge for quick identification.
***
## Trace Detail
Click any execution to see the full trace view.
 ### Metrics Summary
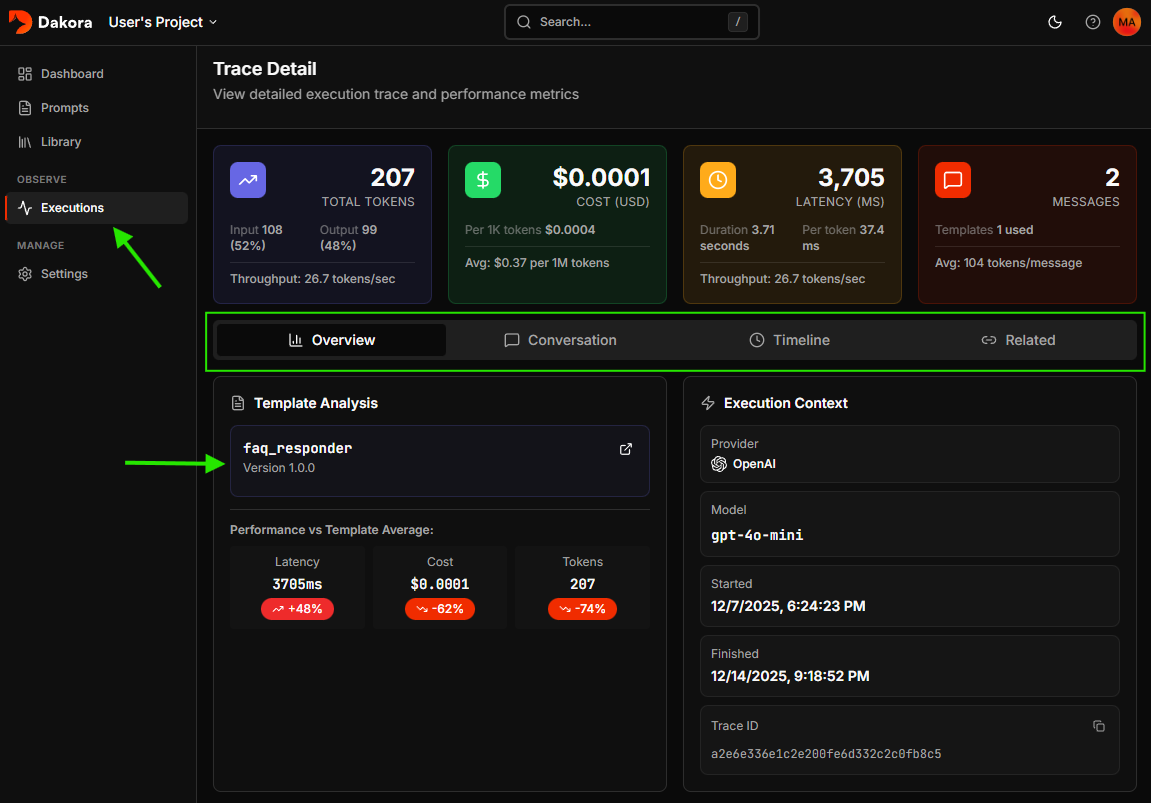
Four key metric cards show:
* **Total Tokens** - Combined input/output with tokens/second throughput
* **Cost** - USD cost with per-1K-token rate
* **Latency** - Response time in milliseconds
* **Messages** - Conversation count and linked templates
### Conversation View
The main content displays the full conversation:
* **User messages** - What was sent to the model
* **Assistant responses** - Model outputs
* **System prompts** - Initial context
* **Tool calls** - Function invocations in agentic workflows
### Template Linkage
If templates were used, the sidebar shows:
* Template name with version number
* Direct link to edit the template
### Timeline View
For multi-step workflows, the timeline shows span hierarchy:
* **Agent spans** - High-level agent invocations
* **Chat spans** - Individual LLM calls
* **Tool spans** - Function calls and responses
***
## Cost Optimization
Dakora analyzes execution history to find savings opportunities.
### How It Works
1. **Usage Analysis** - Examines prompts with 20+ executions
2. **Output Assessment** - Measures average output token count
3. **Variance Detection** - Checks output consistency
4. **Model Matching** - Suggests cheaper models for simple tasks
### Recommendation Cards
Each recommendation shows:
| Field | Description |
| --------------- | --------------------------------------- |
| Prompt ID | The template to optimize |
| Current Model | What you're using (e.g., gpt-4o) |
| Suggested Model | Cheaper alternative (e.g., gpt-4o-mini) |
| Confidence | High, Medium, or Low |
| Weekly Savings | Estimated USD saved per week |
The "Weekly Cost" metric shows a savings badge when opportunities are detected.
### Confidence Levels
* **High** - Low output variance, many executions, simple outputs
* **Medium** - Moderate variance or fewer executions
* **Low** - Outputs may vary; test carefully
***
***
## Best Practices
Leave `embed_metadata=True` (the default) when rendering templates for accurate cost attribution.
Configure alerts at 50% and 80% thresholds before costs become a problem.
Make analytics review part of your routine. Catch trends before month-end surprises.
Implement high-confidence recommendations first for lowest risk and highest impact.
Create distinct projects for dev, staging, and production to avoid skewing analytics.
## Next Steps
Configure spending limits
### Metrics Summary
Four key metric cards show:
* **Total Tokens** - Combined input/output with tokens/second throughput
* **Cost** - USD cost with per-1K-token rate
* **Latency** - Response time in milliseconds
* **Messages** - Conversation count and linked templates
### Conversation View
The main content displays the full conversation:
* **User messages** - What was sent to the model
* **Assistant responses** - Model outputs
* **System prompts** - Initial context
* **Tool calls** - Function invocations in agentic workflows
### Template Linkage
If templates were used, the sidebar shows:
* Template name with version number
* Direct link to edit the template
### Timeline View
For multi-step workflows, the timeline shows span hierarchy:
* **Agent spans** - High-level agent invocations
* **Chat spans** - Individual LLM calls
* **Tool spans** - Function calls and responses
***
## Cost Optimization
Dakora analyzes execution history to find savings opportunities.
### How It Works
1. **Usage Analysis** - Examines prompts with 20+ executions
2. **Output Assessment** - Measures average output token count
3. **Variance Detection** - Checks output consistency
4. **Model Matching** - Suggests cheaper models for simple tasks
### Recommendation Cards
Each recommendation shows:
| Field | Description |
| --------------- | --------------------------------------- |
| Prompt ID | The template to optimize |
| Current Model | What you're using (e.g., gpt-4o) |
| Suggested Model | Cheaper alternative (e.g., gpt-4o-mini) |
| Confidence | High, Medium, or Low |
| Weekly Savings | Estimated USD saved per week |
The "Weekly Cost" metric shows a savings badge when opportunities are detected.
### Confidence Levels
* **High** - Low output variance, many executions, simple outputs
* **Medium** - Moderate variance or fewer executions
* **Low** - Outputs may vary; test carefully
***
***
## Best Practices
Leave `embed_metadata=True` (the default) when rendering templates for accurate cost attribution.
Configure alerts at 50% and 80% thresholds before costs become a problem.
Make analytics review part of your routine. Catch trends before month-end surprises.
Implement high-confidence recommendations first for lowest risk and highest impact.
Create distinct projects for dev, staging, and production to avoid skewing analytics.
## Next Steps
Configure spending limits