Overview
Dakora provides complete visibility into your AI agent operations:- Analytics dashboard with cost trends and performance metrics
- Execution traces with full conversation history
- Budget monitoring with alerts and enforcement
- AI-powered optimization to reduce spending
How Tracking Works
When you render templates with the SDK, executions are automatically tracked:Data Flow
- Template Rendering - SDK embeds a metadata marker in your prompt
- LLM Call - Your agent framework makes the API call
- Span Ingestion - OpenTelemetry spans are sent to Dakora
- Template Linkage - Dakora matches spans to templates via markers
- Analytics - Usage aggregated for dashboards and recommendations
What Gets Tracked
| Field | Description |
|---|---|
trace_id | Unique identifier for the execution |
provider | LLM provider (openai, azure_openai, etc.) |
model | Model identifier used |
tokens_in / tokens_out | Token counts |
cost_usd | Calculated cost based on pricing |
latency_ms | Response time in milliseconds |
messages | Full input/output message history |
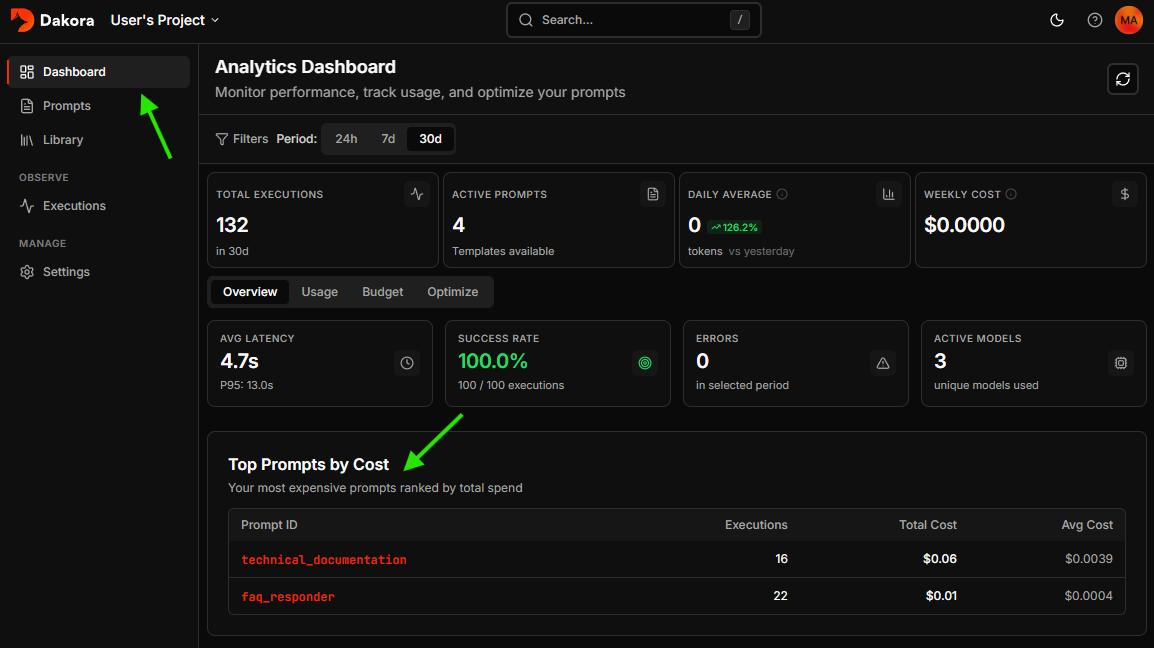
Analytics Dashboard
Access the Analytics Dashboard from your project sidebar for aggregate insights.Key Metrics
| Metric | Description |
|---|---|
| Total Executions | LLM calls in the selected time range |
| Active Prompts | Template count currently in use |
| Daily Average | Token consumption over last 24 hours |
| Weekly Cost | Total spend for past 7 days |
Time Range
Toggle between periods:- Last 24 hours - Real-time monitoring
- Last 7 days - Weekly trends
- Last 30 days - Monthly planning
Health Metrics
The Overview tab shows:- Avg Latency with P95/P99 percentiles
- Success Rate with error breakdown
- Error Count for the selected period
High P95/P99 latency compared to average indicates occasional slow responses. Consider investigating slow model calls.
Token Usage Timeline
An interactive chart showing consumption over time:- Hover to see tokens, cost, and execution count
- Identify usage spikes and patterns
- Correlate with deployments or traffic changes
Model Distribution
See which models consume your tokens:Executions List
Navigate to Executions in your project sidebar to view all LLM calls.Filtering
| Filter | Description |
|---|---|
| Provider | Filter by LLM provider (OpenAI, Azure OpenAI) |
| Model | Search for specific models (e.g., “gpt-4o”) |
| Agent ID | Show calls from a specific agent |
| Prompt ID | Filter by template usage |
| Has Templates | Toggle to show only template-linked calls |
Performance Badges
Executions are tagged with performance indicators:- 🟢 Fast - Under 2 seconds
- 🟡 Normal - 2-5 seconds
- 🟠 Slow - 5-10 seconds
- 🔴 Very Slow - Over 10 seconds
Trace Detail
Click any execution to see the full trace view.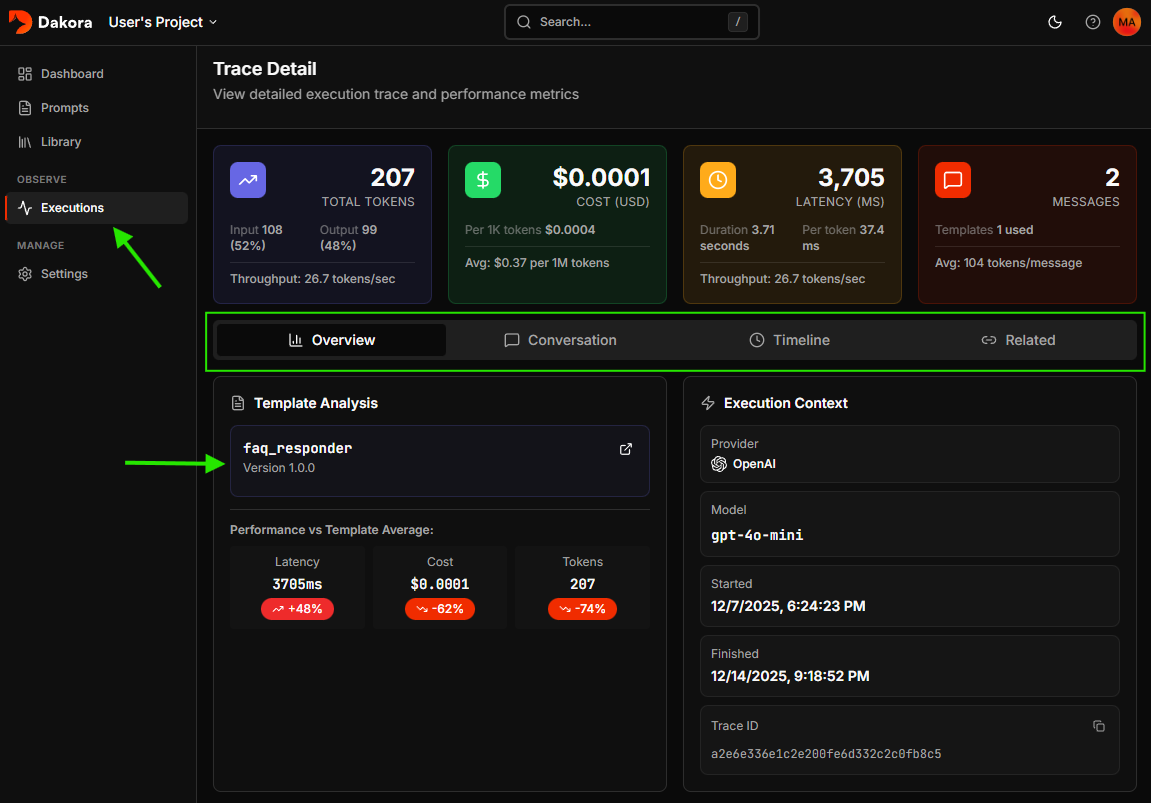
Metrics Summary
Four key metric cards show:- Total Tokens - Combined input/output with tokens/second throughput
- Cost - USD cost with per-1K-token rate
- Latency - Response time in milliseconds
- Messages - Conversation count and linked templates
Conversation View
The main content displays the full conversation:- User messages - What was sent to the model
- Assistant responses - Model outputs
- System prompts - Initial context
- Tool calls - Function invocations in agentic workflows
Template Linkage
If templates were used, the sidebar shows:- Template name with version number
- Direct link to edit the template
Timeline View
For multi-step workflows, the timeline shows span hierarchy:- Agent spans - High-level agent invocations
- Chat spans - Individual LLM calls
- Tool spans - Function calls and responses
Cost Optimization
Dakora analyzes execution history to find savings opportunities.How It Works
- Usage Analysis - Examines prompts with 20+ executions
- Output Assessment - Measures average output token count
- Variance Detection - Checks output consistency
- Model Matching - Suggests cheaper models for simple tasks
Recommendation Cards
Each recommendation shows:| Field | Description |
|---|---|
| Prompt ID | The template to optimize |
| Current Model | What you’re using (e.g., gpt-4o) |
| Suggested Model | Cheaper alternative (e.g., gpt-4o-mini) |
| Confidence | High, Medium, or Low |
| Weekly Savings | Estimated USD saved per week |
Confidence Levels
- High - Low output variance, many executions, simple outputs
- Medium - Moderate variance or fewer executions
- Low - Outputs may vary; test carefully
Best Practices
Keep Tracking Enabled
Keep Tracking Enabled
Leave
embed_metadata=True (the default) when rendering templates for accurate cost attribution.Set Budget Alerts Early
Set Budget Alerts Early
Configure alerts at 50% and 80% thresholds before costs become a problem.
Review Weekly
Review Weekly
Make analytics review part of your routine. Catch trends before month-end surprises.
Start with High-Confidence Optimizations
Start with High-Confidence Optimizations
Implement high-confidence recommendations first for lowest risk and highest impact.
Use Separate Projects
Use Separate Projects
Create distinct projects for dev, staging, and production to avoid skewing analytics.
Next Steps
Project Budgets
Configure spending limits